Subscriber Behavior Report
The Subscriber Behavior report offers marketeers a view of critical statistics including Subscriber Upload Percent, the number of subscribers in each of your offered plans, and a detailed table with line items for each subscriber calling out Total Consumption (GB), Download Consumption (GB), Upload Consumption (GB), and Upload Percent.
The Subscriber Behavior report is particularly useful in identifying subscribers with high upload bandwidth usage such as file sharing or live streaming. Subscribers ranking high in the statistics revealed here would benefit from a campaign offering a specialized service plan that includes increased upload capability.
The data from the charts and the table can be viewed on screen or exported in various formats to your local drive to be consumed offline.
Navigation
Follow these steps to access this report...
-
Select the
 (Promote) icon from the left navigation bar.
 -
Select Subscriber Behavior from the series of rounded buttons across the top of the page.
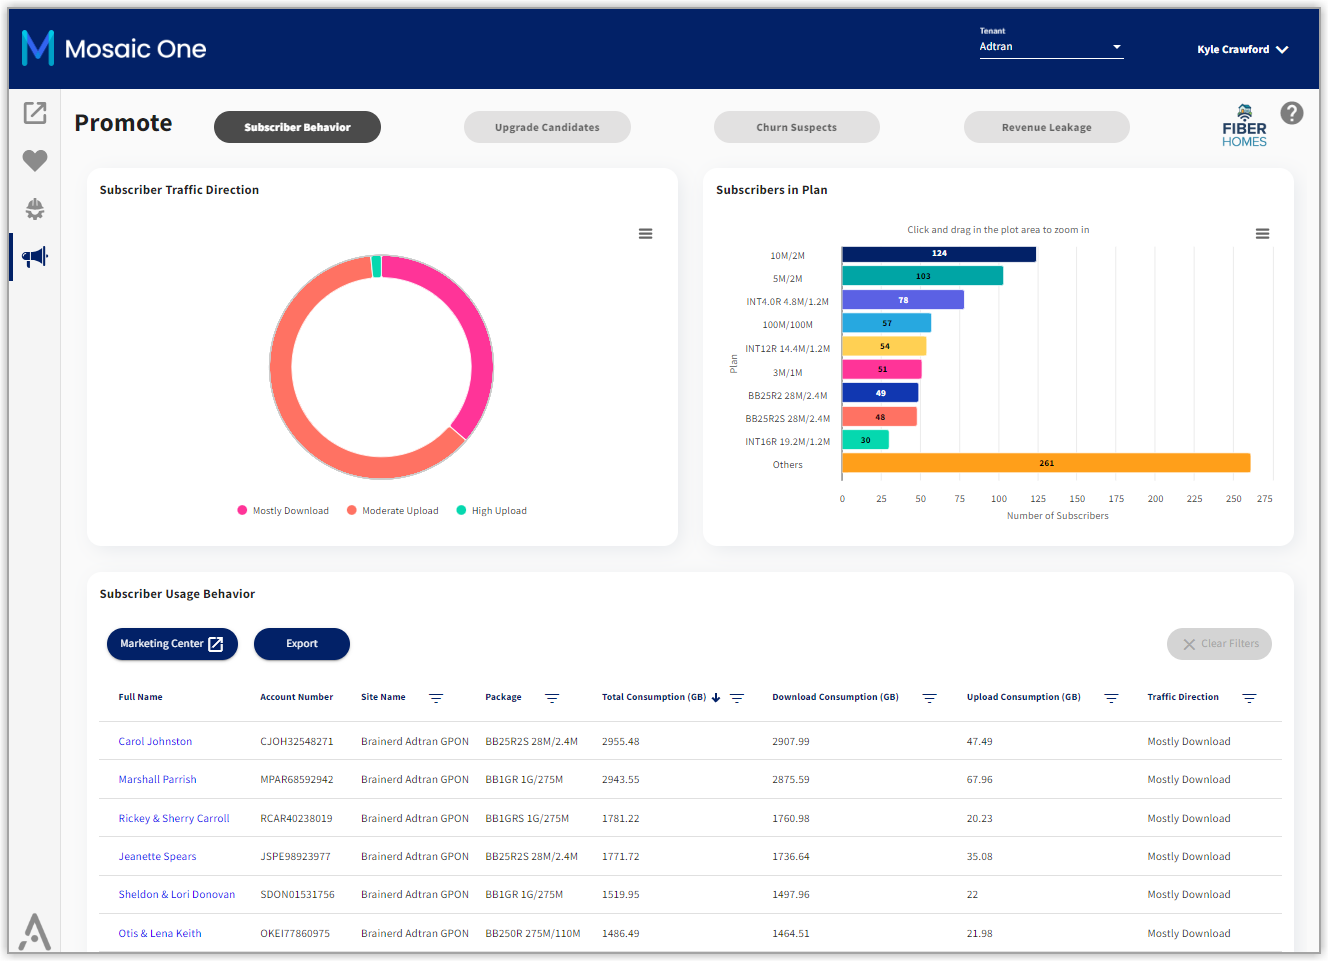
The resulting page displays the following three tiles:
-
Subscriber Traffic Direction: A circular chart ranking subscribers by upload bandwidth (as a percentage of total bandwidth).
-
Subscribers In Plan: A bar chart showing the quantity of subscribers enrolled in each offered plan.
-
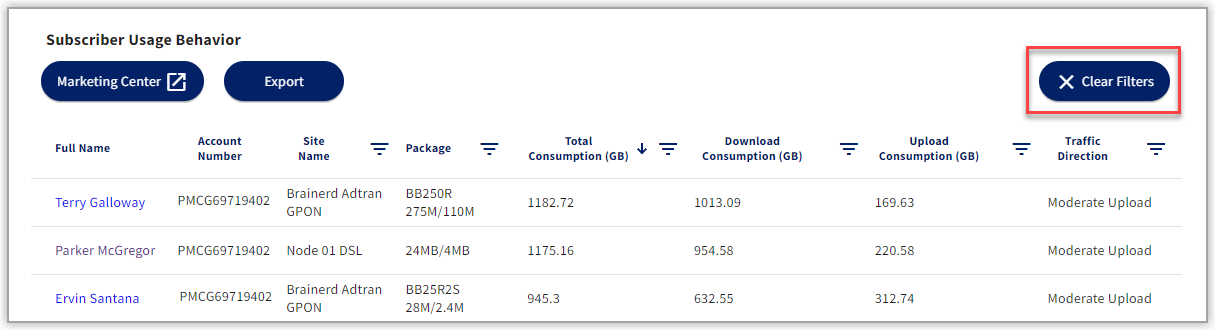
Behavior Usage: A detailed table with a row for each subscriber showing their Full Name, Account Number, Package and a range of statistics related to upload and download consumption. Clicking on a subscribers name will take you to the Care dashboard for that subscriber.
The content of each of these tiles is described in detail in the following sections.
Subscriber Traffic Direction Chart
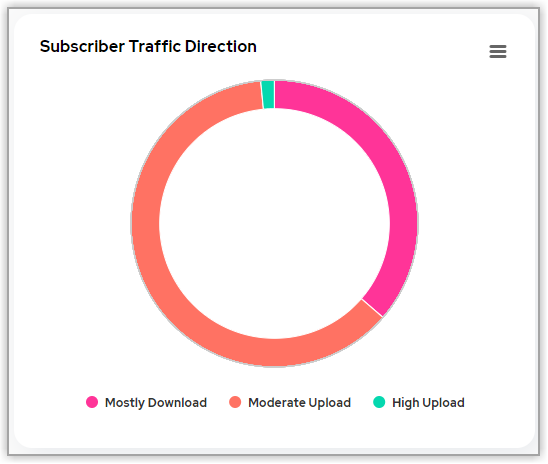
In the upper-left tile, the Subscriber Traffic Direction chart shows the distribution of your subscribers across three categories based on their usage behavior: Mostly Download, Moderate Upload, High Upload.
In combination with the data in the table at the bottom of this report, this traffic direction bias information offers potential insight into whether the current plan the subscriber has is optimal for their usage patterns. Consider creating a communication campaign to target subscribers that would benefit from changing to a plan that is better aligned with their actual usage habits.
Each of these groupings is represented on the circular chart by a different color. Refer to the legend below the chart to find the significance of each color in the chart. Hover the mouse over any colored segment in the circular chart to reveal how many Total Subscribers fall within a given traffic direction grouping.
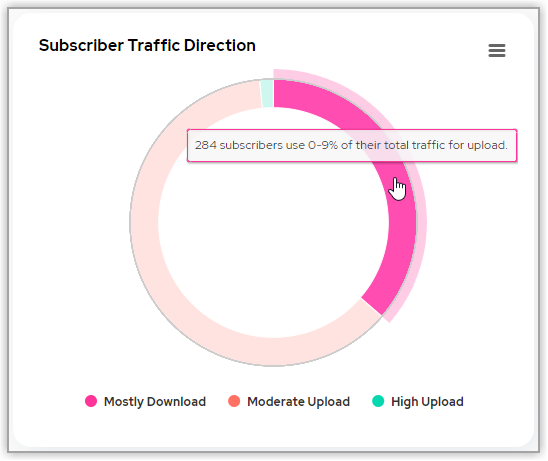
You can interactively customize the chart to display only the color slices/categories of your choosing. Select the text in the legend to toggle each slice/category off (legend color dot will be gray) or on (legend color dot returns to the designated color for that category).
Export or Print Chart Data
To export data from this tile to your local hard drive, select the hamburger menu icon  near the upper right of the chart, and then choose an appropriate file format from the options displayed in the resulting drop-down list.
The following formats are available for export:
-
SVG: Scalable Vector Graphics, an image file format
-
PNG: Portable Network Graphics, an image file format
-
JPG: Joint Photographic Experts Group, an image file format
-
CSV: A comma-separated, raw text file
-
XLS: Microsoft Excel format
Additional options for alternate views of chart data are also available from the same hamburger menu , and include:
-
View in full screen
-
Print chart
-
View data table
Subscribers In Plan Chart
In the upper-right tile, the Subscribers In Plan bar chart shows how many subscribers are enrolled in each of your company's plan offerings.
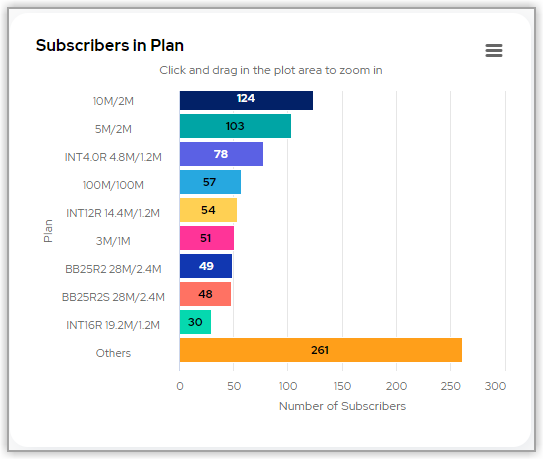
The vertical axis of the chart lists the various plans and the horizontal axis of the chart displays the quantity of subscribers.
(Optional) You can zoom in and reveal a more granular rule for the subscriber count on the horizontal axis. Click-and-drag your cursor across a portion of the chart. The chart zooms to fill the width of display with the span of subscriber count you highlighted.
Select the Reset Zoom button near the upper-right to restore the display to its original state.
Export or Print Chart Data
Just like the Upload Percent chart, the data from this chart can also be exported to various formats and saved on your local drive.
To export data from this tile to your local hard drive, select the hamburger menu icon near the upper right of the chart, and then choose an appropriate file format from the options displayed in the resulting drop-down list.
The following formats are available for export:
-
SVG: Scalable Vector Graphics, an image file format
-
PNG: Portable Network Graphics, an image file format
-
JPG: Joint Photographic Experts Group, an image file format
-
CSV: A comma-separated, raw text file
-
XLS: Microsoft Excel format
Additional options for alternate views of chart data are also available from the same hamburger menu , and include:
-
View in full screen
-
Print chart
-
View data table
Behavior Usage Table
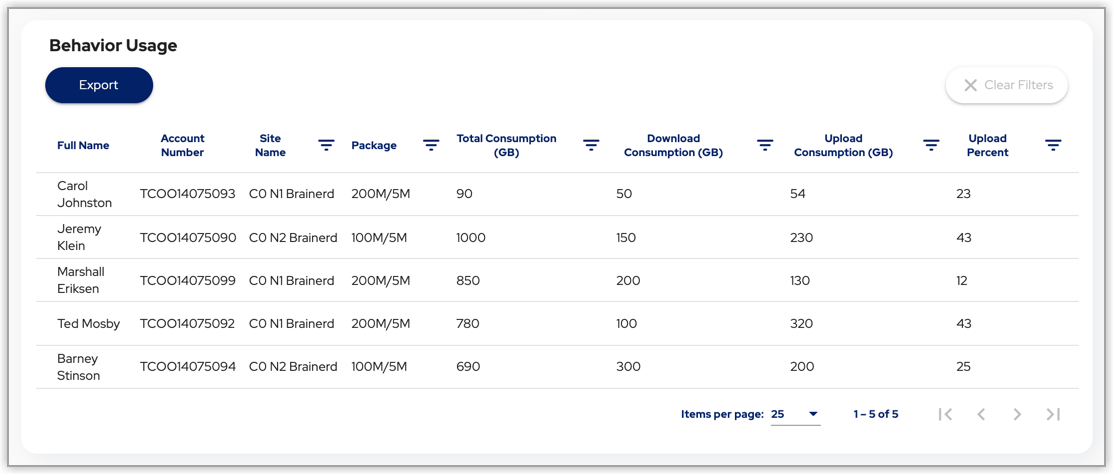
At the bottom of the page, the Behavior Usage table provides the following data for each subscriber:
Column Description
Full Name The first and last name of the subscriber.
Account Number The account number associated with the subscriber.
Site Name The name of the chassis that services this subscriber.
Package The name of the subscription plan to which this customer currently subscribes.
Total Consumption (GB) The total download plus total upload consumption for this subscriber during the past 30 days.
Expressed in gigabytes.
Download Consumption (GB) The total download consumption for this subscriber during the past 30 days.
Expressed in gigabytes.
Upload Consumption (GB) The total upload consumption for this subscriber during the past 30 days.
Expressed in gigabytes.
Traffic Direction The upload bandwidth as a percentage of total bandwidth consumed by this subscriber during the past 30 days.
Expressed in gigabytes. Upload Percent is determined using the following calculation: Upload Bandwidth/(Download Bandwidth + Upload Bandwidth)
Filter And Sort The Table
Select Custom Filtering
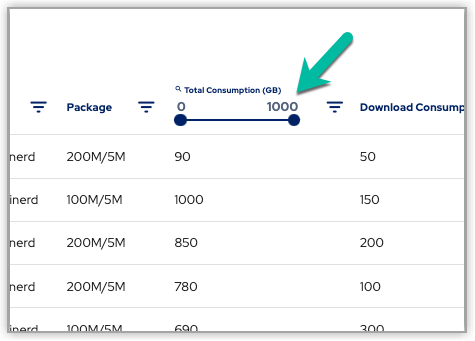
Filters of your choosing can be applied to this table. By selecting the  button adjacent to the header for columns containing numeric data, upper and lower limits can then be set by dragging the endpoints.
-
Drag the right endpoint of the filter toward the left to set the upper limit.
-
Drag the left endpoint of the filter toward the right to set the lower limit.
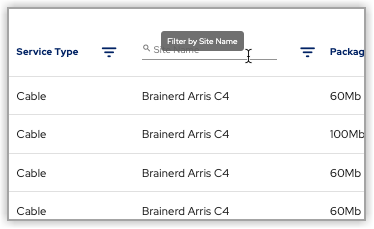
For filtering columns containing non-numeric data, a free-form text field appears instead of the above described interface. Simply key in the string you want to use for filtering, then press the Enter key.
Filter With Charts
Filters can also be applied by using the charts above the table. Select the appropriate variable for the filter you would like to apply. Selecting the variable in the color key below each chart will not apply filters to the table.
Change The Sort Order
The sort order of the data columns can also be changed. Hover your mouse over the column header to reveal a small arrow pointing upward.
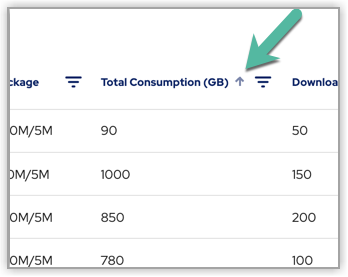
And upwards arrow indicates that the sort order for that column is ascending. Select the arrow to toggle the sort order to descending. The arrow now points downward.
Select the downward pointing arrow icon again to revert the sort order to ascending. The table can only be sorted by one column. Secondary and tertiary sorting is not supported.
Clearing Filters
To clear all applied filters, select the Clear Filters button at the top right of the table.
Export The Table Data
Select the blue, rounded Export button just beneath the table title to export the data to CSV format. A common save dialogue will appear so that you can choose where the file will be saved on your local hard drive.