Card Details
The Card details page offers a view of the card hardware level in the hierarchy of your equipment. See Supported Platforms for details on supported platforms.
Network / Node / Card / OLT / Port / ONU
Navigation
To access this view, from the left navigation bar select the  (Operate) button. A list of all network equipment will populate in a tree view to the left of the map. From the list of equipment that appears, select a Card in your network by clicking on it. Alternatively, each piece of equipment can be searched for by entering the TID or IP address in the search bar at the top of the list of equipment.
The page will populate with the following information for the card hardware selected:
-
Location header: Identifies the parent node and selected shelf and slot, and provides navigation back to the node dashboard.
-
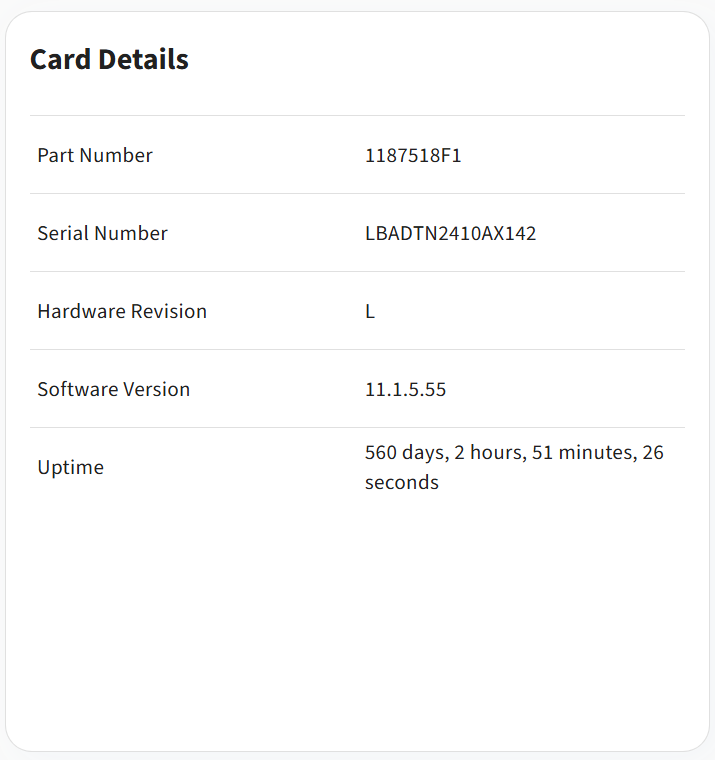
Card details: Displays manufacturer details for the selected line card, including the part number, serial number, hardware revision, software version, and uptime.
-
Backplane Bandwidth utilization: Displays the bandwidth utilization on the backplane link between the switch module (SM) and the selected card.
-
Insights: Displays alerts (insights) associated with the selected card.
The content of these tiles is described in detail in the following sections.
Location header
The Location header tile identifies the parent network node and selected shelf and slot in access and aggregation network topology. It provides a button that navigates back to the node dashboard.

Card details
The Card details tile displays manufacturer details for the selected line card, including the part number, serial number, hardware revision, software version, and uptime.
Backplane x/y/z Bandwidth Utilization
This tile shows bandwidth utilization on the backplane link between the switch module (SM) and the selected card. Two charts are displayed in this tile: Data for the link from SM slot A is shown in the left chart and SM slot B data is displayed to the right.
The title of the chart Backplane Bandwidth x/y/z maps out as follows:
-
x = The shelf you selected in the Shelf search field immediately above this chart.
-
y = The SM slot (A or B).
-
z = The slot you selected in the Slot search field immediately above this chart.
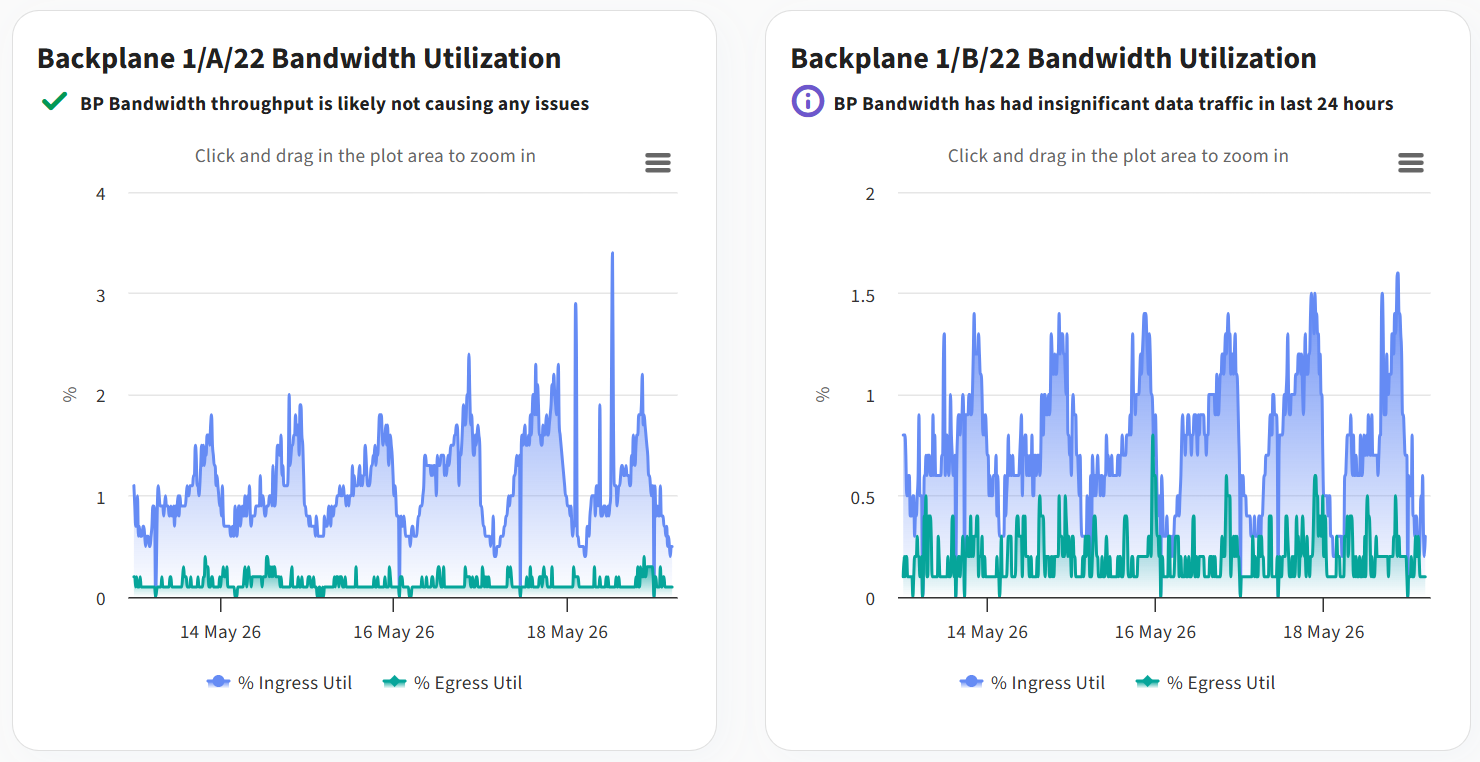
The horizontal axis of this graph shows the progression of time across the most recent five days while the vertical axis shows percent of utilization. The vertical scale will automatically adjust depending upon peak utilization recorded during the five day period.
This chart is also color coded to distinguish ingress utilization (shown in blue) from egress utilization (shown in green). If utilization of bandwidth becomes high, a red threshold line will appear. Sweep the mouse cursor horizontally along the time series chart and the tool-tip will highlight ingress and egress utilization statistics for that specific moment in time.
You can also specialize the display at will to show only ingress or only egress data by selecting the text label or colored dot in the legend below the chart.
-
Select % Egress Util or the green colored dot to toggle the display of egress data on and off.
-
Select % Ingress Util or the blue colored dot to toggle the display of ingress data on and off.
Export or Print Table Data
To export data from this tile to your local hard drive, select the hamburger menu icon ( ) near the upper right of the chart, and then choose an appropriate file format from the options displayed in the resulting drop-down list.
The following formats are available for export:
-
SVG: Scalable Vector Graphics, an image file format
-
PNG: Portable Network Graphics, an image file format
-
JPG: Joint Photographic Experts Group, an image file format
-
CSV: A comma-separated, raw text file
-
XLS: Microsoft Excel format
Additional options for alternate views of chart data are also available from the same hamburger menu (), and include:
-
View in full screen
-
Print chart
-
View data table
Insights
The Insights tab displays a list of alerts across all network hardware. Found above this list are the "Top 5 Nodes by Insight Count" and "Top 5 Categories by Insight Count" charts.
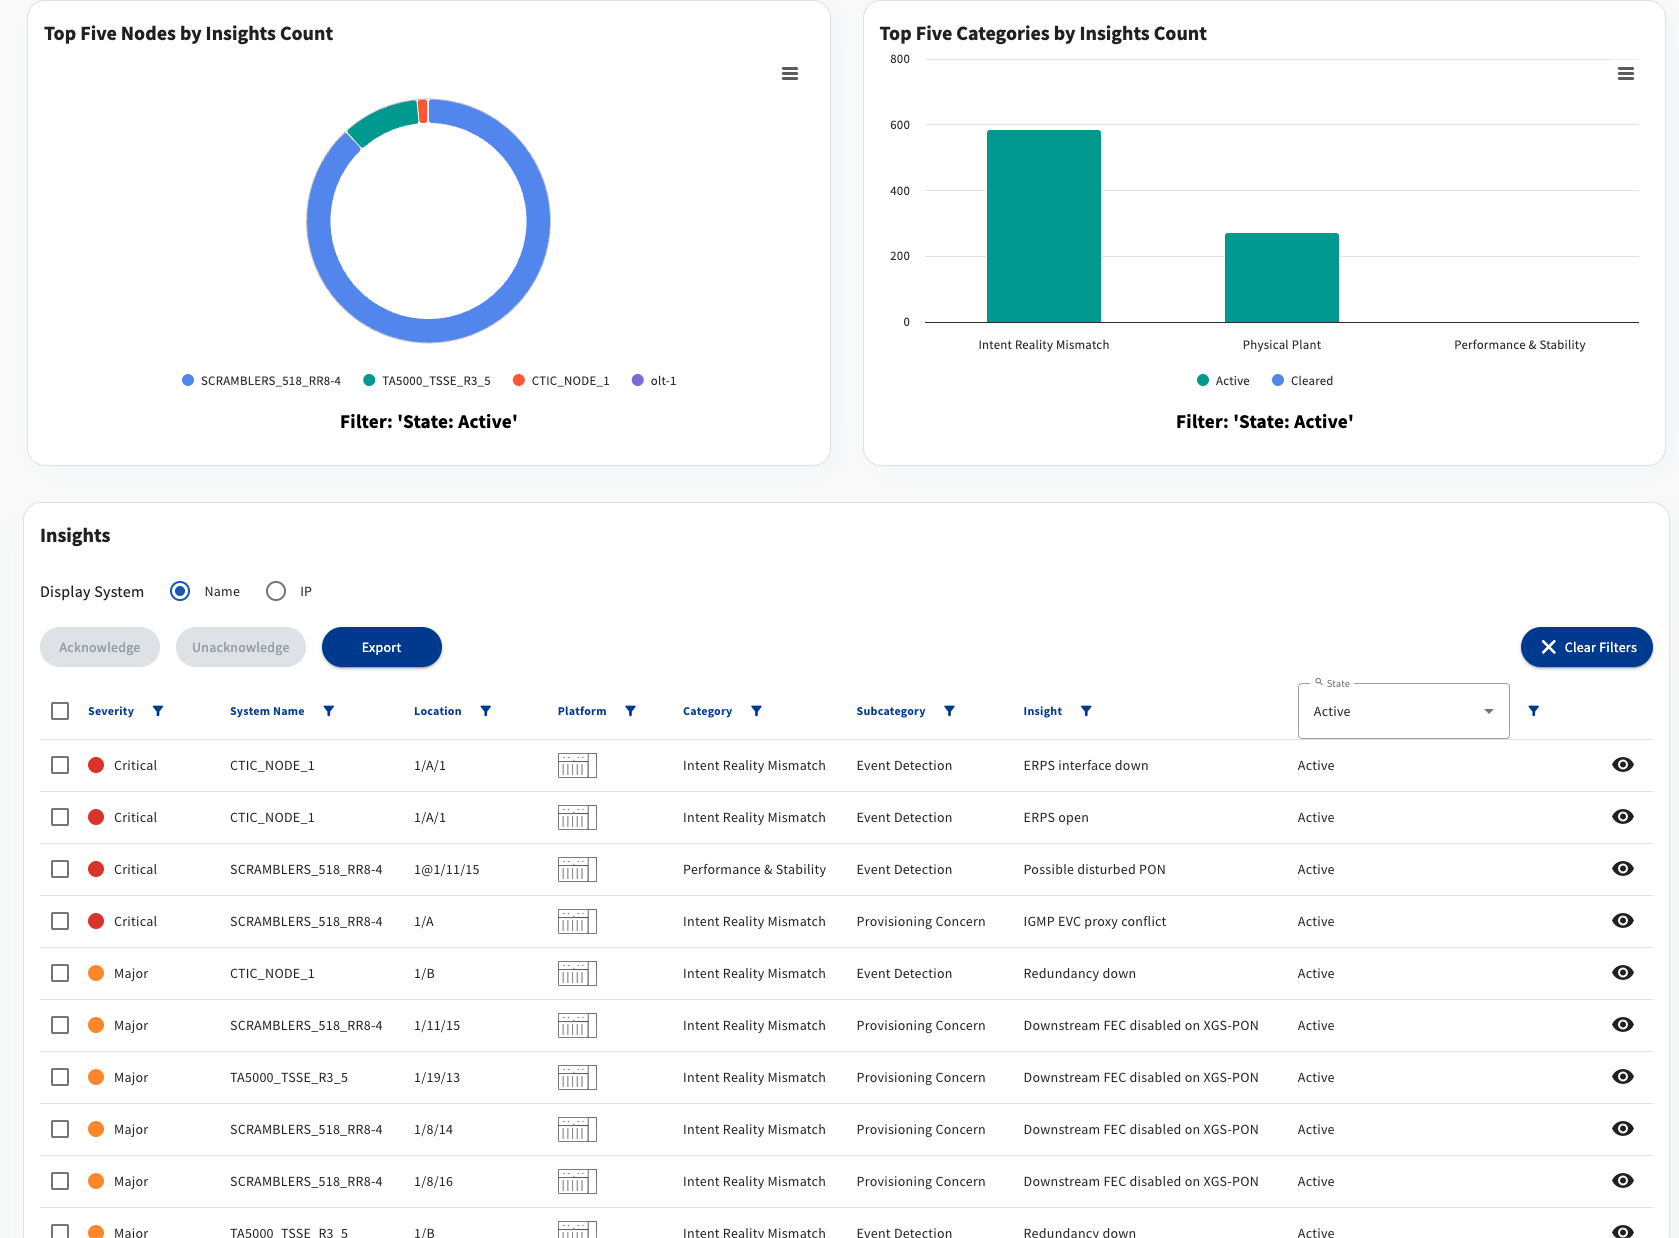
Filters of your choosing can be applied by leveraging the various search fields placed just above the column headers. These search filters may be used individually or in combination to specialize the display to meet your needs.
Access the search field by selecting the adjacent  button, then enter the search criteria in the text field that appears.
Top 5 Nodes by Insight Count Chart
Displays the top 5 nodes for the insights table based on the current filter for the table. It's contents will change based on the filter selected in the insights table. Clicking on a segment of the donut chart will filter the contents of the table to the node's 'System Name'. Clicking anywhere on the chart will clear the node filter in the table below.
Top 5 Categories by Insight Count Chart
Displays the top 5 categories for the insights table based on the current filter for the table. This bar chart has the active and cleared counts stacked for each of these top 5 categories. It's contents will change based on the filter selected in the insights table. Clicking on a bar will filter the contents of the table by the clicked insight category. Clicking anywhere on the chart will clear the category filter in the table below.
Insights - Table Columns Defined
Each column of the table of insights displayed on screen is described below.
Severity
A rating of the severity of the alert rated on a scale of 0-5. The significance of each rating is:
- Severity 5: Critical
- Severity 4: Major
- Severity 3: Minor
- Severity 3: Minor
- Severity 2: Alert
- Severity 1: Informational
System Name
Top-level name of the network device.
Location
The identifier of the network location associated with the insight. Exact format of the field will vary depending on the source location.
For example
- Shelf/slot/port
- Slot/port
- RemoteID@Shelf/slot/port
Platform
Hover over the displayed platform icon to view the platform's family and type. The icon will vary depending on the platform type.
For example
- Platform Family: Total Access; Platform Type: TA5000
- Platform Family: SDX; Platform Type: SDX 6320-16
- Platform Family: Calix; Platform Type: Calix E7-Series
- Platform Family: Zhone; Platform Type: Zhone MXK
Category
A category of network insights that enables filtering of insight groups based on the same classification.
For example
- Intent Reality Mismatch
- Physical Plant
Subcategory
A subcategory of network insights that provides a detailed classification of insights within a specific category.
For example
- Intent Reality Mismatch > Provisioning Concern
- Physical Plant > Connection Issue
Insight
A short description of the nature of the alert detected for this row.
See the Operate Detail Views - Insights Glossary for a list of all insight names and detailed descriptions for each.
State
Insights presented are in one of three states: Active, Cleared, or Acknowledged.
- Active: An active insight is one that has been detected in the most recent scan.
- Cleared: Insights shown as cleared were not detected by the most recent scan. The system retains cleared insights for 30 days before automatically removing them from the display.
- Acknowledged: An acknowledged insight is one that has been manually acknowledged by selecting the insight and selecting the Acknowledge option.
Insight Details Icon
 Select this icon to reveal the Insight Details dialog. All key facts regarding this insight are displayed in an easy to read layout that includes a suggestion as to how the alert might be resolved.
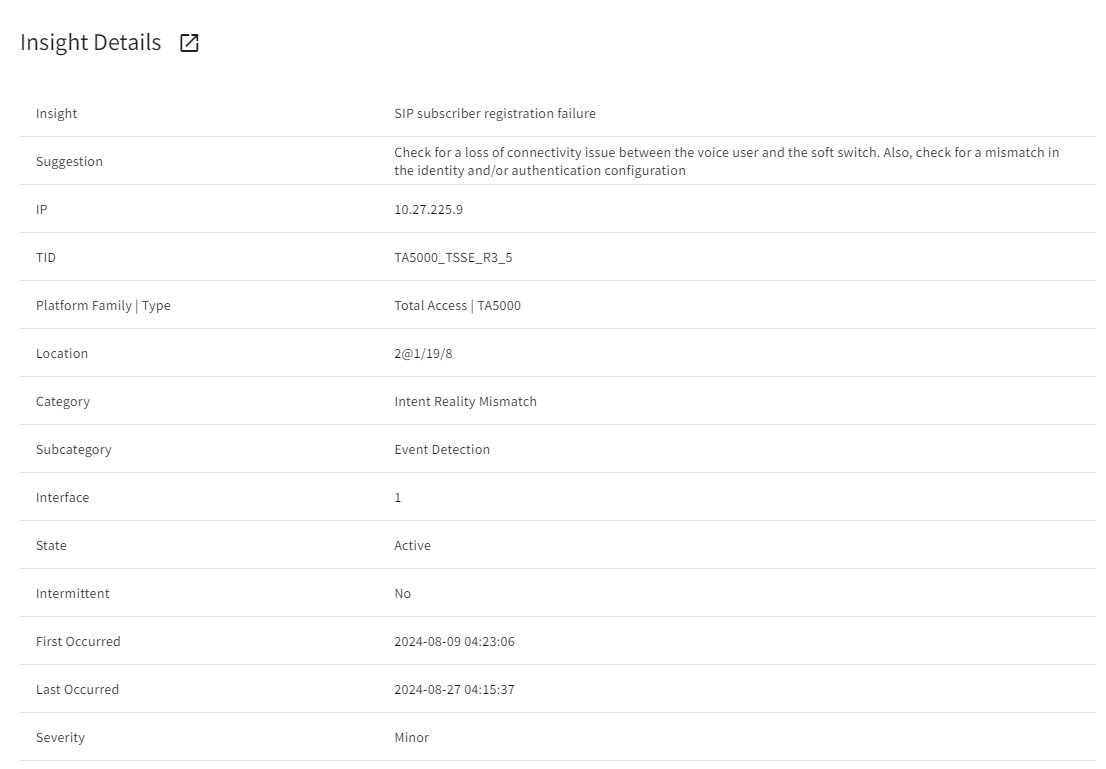
Select the  icon at the top of Insight Details to navigate to the device associated with this insight.
An intermittent insight is an insight that has previously been cleared, but has reoccurred.
Since MSI allows users to edit the field, the MSI TID could be different than the Operate TID.
Acknowledge / Unacknowledge Buttons
The  button is located just beneath the radio button selector for TID/IP near the top of the Insights panel.
To use this feature, choose one or more insight(s) and then select the button to change all selected insights to the Acknowledged state.
The  button is located to the right of the Acknowledge button.
To use this feature, choose one or more insight(s) and then select the button to remove the Acknowledged state. This will set insights back to their default state where they display either Active or Cleared.
Both Active and Cleared insights may be in the Acknowledged state. If an Acknowledged and Cleared insight becomes Active again (intermittent), the Acknowledged state will only reset and show as Active if the severity increases.
Export Button
The  button is located just beneath the radio button selector for TID/IP near the top of the Insights panel.
Use this feature to export this current snapshot of insights to your local drive in CSV format. The exported data can be useful for purposes such as:
-
Sorting the list and delegating portions of it to task various personnel with resolving the alerts.
-
Using it as an offline scratchpad to make notes about your pursuit of the resolution for each alert.
The on-screen display is limited to the first 4mb of Insights data. When this cap is exceeded, a notification will appear with a reminder that this Export feature can be used to get the complete list of insights in CSV format.